Archive for the ‘Services Operations’ Category

Knowledge Management: Failure Points

July 6, 2010

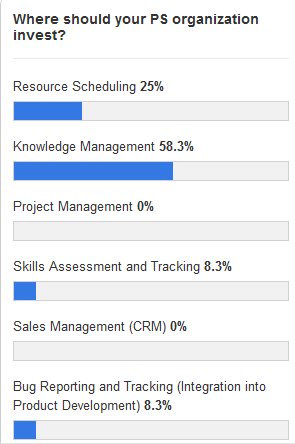
A few weeks ago, I asked readers to vote on where PS organizations should be investing to improve performance. The early voting is showing readers believe knowledge management is where there is bang for the buck:

Where should PS invest?

We know from our benchmarking that PS organizations invest about 3% of their revenues back into services engineering efforts. A subset of that investment goes into knowledge management infrastructure.  Is this the right investment level? My observation is that PS organizations limit their investment in knowledge management infrastructure because they just don’t know what the return on investment truly is. Why is the return on knowledge management so unclear to PS organizations?

(more…)

Solution Centers: Fresh Data

June 21, 2010

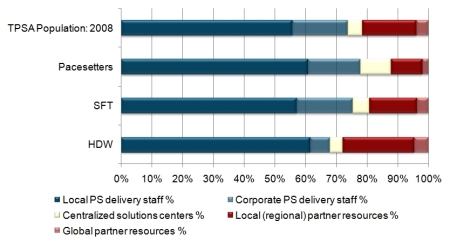
At TSIA, we have been tracking the evolution of PS delivery models. Over the past five years, embedded PS organizations have continued to modify their delivery strategies to improve profitability and scalability. One of the key tactics some PS organizations are pursuing is the creation of “solution centers.” These are centralized pools of technical resources that are leveraged across multiple engagements in multiple geographies. The image below shows how the sourcing mix for embedded PS organizations has been shifting over the past three years:

I have written two previous blog entries related to solution centers:

Now, TSIA has completed a survey on the practices being employed by companies as they build and optimize these solution centers.

(more…)

Where PS Should Invest

June 9, 2010

Tomorrow, I host a webcast with my colleague John Ragsdale and one of our TSIA partners, Compuware. John will be highlighting several areas where he believes PS organizations can best benefit from investing in technology infrastructure. To join us, please register by visiting:

http://webcasts.tsia.com/event/g5u6c1pnc2/tsia

For sure, I can tell you two facts regarding infrastructure investment within PS organizations:

1. Skinny Investment

On average, PS organizations  reinvest 5% of their revenues back into non-billable, General and Administrative (G&A) activities. That 5% is typically used to cover not only non-billable headcount but the IT infrastructure required to support the PS business. One of the most common problems we see when benchmarking PS organizations is that they spend only 1% – 3% on G&A. This means they are barely investing in any infrastructure to support the business.

2. Positive Correlation

We also know that PS organizations that invest PSA infrastructure, on average,generate higher operating incomes. This is a fact we have been sharing with TSIA members for several years when they benchmark with us. The data point helps make the case for investment.

So, PS organizations have a tendency to under invest in technology, yet we see improved financial performance when infrastructure is in place. Quite the paradox!

Tomorrow, John will be discussing the areas he believes PS organizations can benefit the most from infrastructure. I’m curious what you think. In the poll below, pick the top two activities where you feel your PS organization would benefit the most from technology infrastructure.

Solution Centers: Sourcing Survival Strategy #4

March 3, 2010

Right now, Bo DiMuccio and I are working on a Services Insight for the TSIA community titled “Seven Sourcing Survival Strategies.” The paper overviews tactics embedded PS organizations should be pursuing to stay competitive in the technology services marketplace. One of the tactics we discuss is leveraging centralized solution centers. In this blog entry, I will share some of the content from the pending paper. However, before I delve into the topic, I want to make TSIA members aware that we are currently conducting a member survey that captures both practice and results data related to optimizing solution center resources. To participate in this study and receive the readout, please visit:

http://www.tpsaonline.com/member_surveys.asp#pssolcenpractices

(more…)

The TSIA Service 50

October 26, 2009

This Thursday, I will be hosting our quarterly Service 50 webcast. It is open to the public.  Follow this link to register:

http://webcasts.tpsaonline.com/event/v12hg2c78k

For those readers that have not attended in the past, I host a webcast every quarter that reviews the financial performance of fifty of the largest providers of technology services. The analysis is designed to answer the following questions regarding trends in tech services:

  1. Who are the best performing providers of technology services?
  2. Are technology service margins trending up or down?
  3. Are net incomes trending up or down?
  4. Are hardware and software companies becoming more or less service intensive?
  5. What is the product service mix for the most profitable companies in the Service 50?
  6. What is the product service mix for the largest companies in the Service 50?

As I review the Q3 data, I can tell you the global downturn clearly caught up to the tech companies this past quarter. However, there are some surprises. Also, service revenues and margins are continuing to play a critical role as product revenues and margins lag.

Join me Thursday for all the key trends.

Why Solution Centers?

October 14, 2009

Earlier this year, I wrote about the bifurcation of sourcing strategies  within embedded PS organizations. In this post, I discussed the fact that results from a new TPSA survey showed an emerging class of product companies that are deploying a much more leveraged model for sourcing services engagements. A model where centralized solution centers, local partners, and global partners play a key role.

We believe the trend to create leveraged delivery models will continue. Specifically, we expect PS organizations within product companies to aggressively leverage centralized solution centers, where a pool of delivery expertise is established in a centralized location and leveraged across multiple geographies. Embedded PS organizations are creating these solution centers for several reasons, including:

  1. To increase the ability to provide service offerings to low volume geographic locations, where it does not make sense to establish a large local delivery presence.
  2. To support low volume service offerings that are important to product adoption but not demanded enough to warrant training local delivery staff in delivering the offering.
  3. To drive consistent delivery methodologies across engagements throughout the world
  4. To accelerate the creation of unique expertise around emerging solutions.
  5. To provide a resource buffer for lumpy demand within each geography

Moving forward, we will be trending the resourcing mix of embedded PS organizations. We know from a multi-member study conducted this year, that a majority of embedded PS organizations have less than 5% of their delivery cycles being sourced from centralized solution centers. The image below shows results from that study for various peer groups.
Resourcing Mix for Embedded PS Organizations

Resourcing Mix for Embedded PS Organizations

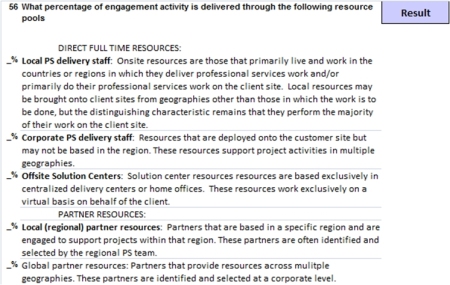
In November, we will be launching an updated industry benchmark study that collects thirty new data points related to the practices and results of PS organizations.  One of the new questions will capture data on the resourcing mix as shown below.
New Benchmark Question on Resourcing Mix

New Benchmark Question on Resourcing Mix

At the Technology Services World conference next week, I will be reviewing the entire update to the TPSA benchmark study in the breakout session titled Comprehensive Update of the TPSA Benchmark Survey and Database:

Hope to see you in Vegas next week. If you are a fan of the blog and you are at the conference, make sure to introduce yourself.
Billed but not Charged

September 2, 2009

I love discussing and debating the intricacies of services strategy within product companies. However, the most popular blog entry I’ve written to date is the one that defines a standard method for calculating utilization for delivery staff. It has generated several comments and questions—a majority made directly to me. A question that came in last week concerns hours that are billed to a customer but not successfully charged. The question had two parts:

  1. Where should hours that were billed but not charged be categorized using the schema provided in calculating utilization?
  2. What is a reasonable target for the number of hours billed but not charged?

Let’s explore both of these questions.

(more…)

IBM and the Science of Sourcing Services

July 13, 2009

 IBM Press published a book titled Reaching the Goal by John Arthur Ricketts. I believe this book represents the state of the art thinking on tactics to manage the sourcing of technology service engagements. This body of work is aligned with IBM’s Service Science, Management and Engineering (SSME). initiative. This is a multi-disciplinary research and academic effort that integrates aspects of established fields like computer science, operations research, engineering, management sciences, business strategy, social and cognitive sciences, and legal sciences to improve the management of service businesses. One of the ultimate goals of this emerging discipline is to help companies attain the ability to deliver complex technology solution in an “on demand” fashion. Reaching the Goal should be required reading for anyone responsible for sourcing service engagements or managing a technology professional services organization. In this post, I want to summarize some of the key observations made by Ricketts that highlight why sourcing service engagements is indeed a complex process that requires sophisticated processes.

(more…)

Can PS Partner?

May 31, 2009

Every services organization eventually establishes partnerships of one form or another with other services organizations.  For PS organizations, those partnership opportunities present themselves in three categories:

Sub-contractors: These are partners that help the services organization deliver services engagements. The services project is booked by the product company and these partners provide resources to help deliver the engagement. These partners provide skills that complement or augment the resources of the services organization.

Resellers: These are partners that resell the products and services provided by the company. They most likely provide their own value add services to help implement the products of the company. Their capabilities can overlap with the capabilities of the embedded services organization.

Influencers: These are partners that my not necessarily resell the products or services of the company but they can have a significant influence on what products companies purchase. Think large system integrators like Accenture which help companies decide what technologies to implement.

Last week I buried myself in the data we collected from our 2009 Partner Practices survey. Forty companies provided information on both practices and results surrounding their engagement with these types of partners. From my perspective, the results were a little disheartening.

(more…)

IBM: The Services Margin King?

May 22, 2009

A TPSA member forwarded an article in which IBM CEO Sam Palmisano was quoted as saying “Services has been a terrific story — we now have the best margins in the service business of anybody.” Now, I don’t know if Mr. Palmisano actually made this statement or not. I do know we track the services margin performance of the largest providers of technology solutions in the industry. IBM is on that list. and the data does not support the statement.

(more…)