Last Thursday, we delivered our analysis of how fifty of the largest providers of technology services performed in Q4 2008. Companies in our index include hardware, software, and pure services companies. Example companies include:
- Accenture
- Cognizant
- Cisco
- HP
- IBM
- Infosys
- Oracle
- SAP
Analyzing the Q4 data, we saw three trends important to every provider of technology services.
FIRST TREND: TECHNOLOGY COMPANIES FAIRED WELL IN 2008
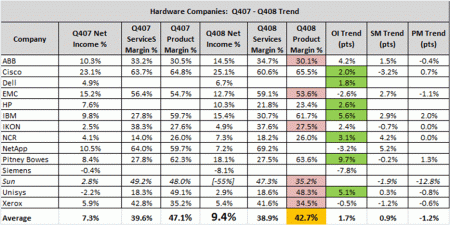
All three of the distinct types of companies in our index, hardware, software, and pure services companies, performed relatively well in a difficult 2008. Pure service companies like Accenture and BearingPoint improved their gross margins and profits. Hardware giants Cisco, HP, and IBM all improved Q4 2008 operating incomes percentages over their Q4 2007 percentages. Software giants Oracle and SAP did the same. The figure below shows the averages for the thirty-nine companies that were in the Q4 2007 and Q4 2008 snapshots. As can be seen, all categories trended up in 2008 except product revenues, which leads us to the second key observation.

Q4 2007 - Q4 2008

Hardware Companies Q4 2007 - Q4 2008
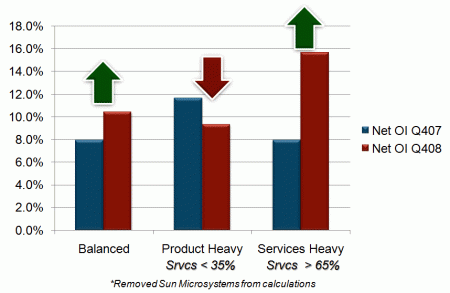
Finally, we analyzed how different product-service revenue mixes performed in Q4. The chart below breaks companies in the Service 50 into three buckets:
-
Services Heavy: Companies with 65% or more of their revenues coming from services
-
Product Heavy: Companies with less than 35% of their revenues coming from services
-
Balanced: Companies with 36% – 64% of their revenues coming from services.
This analysis shows that companies with “services heavy” or “balanced” revenue mixes outperformed product heavy companies in Q4 2008. This makes sense intuitively. If capital spend is tightening, services revenue streams become more important. Also, customers seem more inclined to invest in optimizing existing infrastructure than buying new products—this equates to more services spend, not product spend. This creates a dynamic we call the “services buffer.” This is the financial buffer services revenues and margins create for product companies when product revenues are flat or declining. Every indicator we see tells us this buffer will be critical to the profitability of many product companies in 2009.

Mix Performance Q4 2008
Tags: Product Services Mix, Technology Services Industry, The Service 50
February 8, 2009 at 10:29 am |
[…] Service Visions Framing Technology Professional Services « Health Check: Technology Services […]
March 3, 2009 at 1:48 pm |
[…] of product companies post 2001 downturn. Then, on February 2nd of this year I wrote a post titled Health Check: Technology Services in which I reviewed the current trends emerging from our analysis of fifty of the largest providers […]
March 23, 2009 at 3:51 pm |
[…] it is worth referencing my previous post on how companies with a more balanced portfolio of products and services posted better profits in […]